
What to Measure
Measure the model's mechanics, not delivery volume
The instinct when adopting a new operating model is to measure output. How many increments shipped, how many lines of code the fleet produced, how many points completed. Organizations have stood up exactly those dashboards for years, and what happens during a transition is predictable: the volume metrics look strange, people get nervous, and then people start gaming them.
Measure the mechanics instead. The mechanics are what make the model work. If they are healthy, the outcomes follow. If they are broken, no amount of output measurement will tell you why.
One rule sits above everything in this article: no measure is complete until it has a decision attached to it. A rising Replace rate should change slice size. Slow blocker resolution should change authority. Weak daily presence should force the funding conversation the portfolio avoided at intake. Evidence compounds only when someone uses it to alter the next move. Otherwise the ledger is just a more current status report.
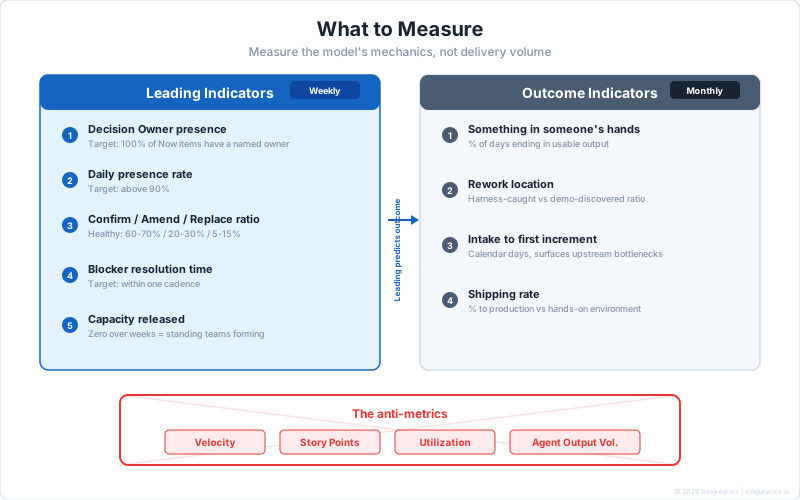
Velocity and its cousins
Velocity, story points, utilization, and output volume. Each one actively distorts the behavior this model requires.
Velocity creates pressure to increase output, which leads teams to accept on weak evidence, thin out the spec to start building sooner, and resist the Replace call because it looks like lost velocity. Story points estimate effort in a world where the fleet produces an increment in a day; the relationship between estimate and effort is broken, and points become ceremony that consumes spec time. Utilization rewards busyness in a model where availability is the valuable thing. A Decision Owner at 100% utilization has no time for the questions that keep the build day moving. Agent output volume is the most dangerous of the four, because it is the easiest to optimize and the furthest from value. A fleet producing twice the code is producing twice the review load, and if review quality degrades, twice the defects.
The DORA and flow metrics deserve their own sentence, because they are good measures that answer a different question. Deployment frequency and change lead time measure the machine half of the system, and in this model the machine half is rarely the constraint. A portfolio can post excellent flow numbers while owners are absent and the Replace rate sits at zero, which is a system optimizing its healthy half while its judgment half decays. Keep the flow measures if they are already instrumented, and read them after the judgment measures, not before.
Leading indicators, weekly
These tell you the mechanics are failing days before the outcomes show it.
Decision Owner coverage. Percentage of Now items with a named owner at the committed release level. The target is 100%, because this is the gate. Anything less means something is in Now that is not really in Now. See No Owner, No Now.
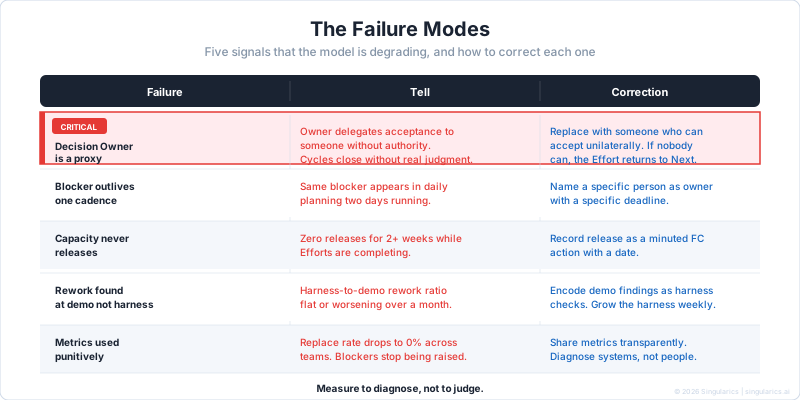
Daily presence. Percentage of working days the owner attended planning and was available for questions. Above 90%. An absent owner is a silent failure: the team keeps working, nobody accepts, the cycle does not close, and the team drifts.
The Confirm, Amend, Replace ratio. Watch for drift rather than a fixed number. The healthy neighborhood is 60-70% Confirm, 20-30% Amend, 5-15% Replace. High Replace means the slices are too big or the Effort is exploratory and should change cadence. Zero Replace means the work may not need this model. High Amend with low Confirm means the team is learning daily but the learning is not reaching the spec queue.
Blocker resolution time. Within one cadence, daily for the Flow Council, biweekly for the Intent Council. A blocker that outlives one cadence killed a cycle. Two cadences, and it has probably stalled the Effort.
Capacity released. How much returned to the pool this week. No fixed target, but zero for several weeks while Efforts complete means standing teams are forming. Measuring release is what keeps the pool model honest.
Outcome indicators, monthly
Something in someone's hands. Percentage of days ending in something a human could use, shipped or landed in the hands-on environment. This is the floor of the model. If increments are not reaching a place where someone can use them, the feedback loop is broken. See Ship or Learn.
Rework location. Rework caught by the harness versus rework discovered at or after the demo. The ratio should move sharply toward the harness as it matures and the Domain Knowledge Network encodes more constraints. If it does not, either the harness is not growing or its checks are not aligned with the criteria.
Intake to first landed increment. Calendar days from sponsored request to first landing. This measures the full pipeline, and it surfaces what the daily cycle cannot see. If the build cycle is one day and intake to landing is six weeks, the constraint is upstream of the team.
Shipping rate. Percentage of increments reaching production versus stopping at the hands-on environment. This measures clearance maturity, not team performance. A low rate means approved deployment paths have not been established for the portfolio's change classes, and establishing them is among the highest-value work the Flow Council can do.
Two network-health measures belong here too: expert hours per outcome should trend down while coverage of encoded constraints trends up. Flat on both means encoding is not happening.
A Tuesday reading
The measures earn their keep in combination, so here is one composite reading and the decision it forced. Owner presence sits at 84%, just under the line. The Confirm rate has run above 90% for three weeks, Replace at zero. Rework caught at the demo rather than the harness is creeping up. Any one of those alone is a shrug. Together they tell one story. The owner is stretched, planning has stopped being a real decision, the specs are gliding through unchallenged, and the harness is quietly falling behind what the specs claim. The correction was not a dashboard review. The Flow Council raised the owner's release with the sponsoring officer, and daily planning got its Replace question back. Three weeks later the Replace rate was 8% and demo-stage rework had turned. That is what a measure with a decision attached looks like in practice.
The failure mode dashboard
If you build one dashboard, build it from these five signals.
| Signal | Healthy | Warning | Critical |
|---|---|---|---|
| Decision Owners at committed release | 100% of Now items | Below 100% | Any Effort without an owner |
| Owner daily presence | Above 90% | Below 80% | Below 60% |
| Blocker resolution | Within one cadence | Occasional overrun | Persistent overrun |
| Capacity released this month | Regular releases | No releases in 2+ weeks | No releases in a month |
| Rework caught by harness vs. demo | Ratio improving | Ratio flat | Ratio worsening |
The ways measurement fails
Metrics used punitively. Rank or punish teams with these numbers and the teams will optimize the numbers. The Replace rate drops to zero because nobody admits the plan was wrong. Blocker resolution improves because blockers stop being raised. Measure to diagnose, not to judge, and use the metrics to find systemic issues rather than individual failures.
Leadership wants a single number. Understandable, and unanswerable. The model has several mechanics that can be healthy or broken independently, and a single number hides the diagnosis. The closest thing to a summary is the percentage of days ending in something a human could use, and even that needs context. A day that ended in a learning outcome is not a failure. A day that ended in a shipped increment on a red harness is.
A metric looks too good. Six weeks of 100% Confirm means the work is truly predictable and may not need this model, or the team has stopped admitting when the plan was wrong. Investigate before celebrating.
Reading too early. In the first month, the team is learning the model, the spec process is uncalibrated, and the harness is young. Use month one for baselines and month two for diagnosis.
Its place in the Model
In The AI-Native Operating Model™, measurement flows from the evidence ledger, which sits in the cross-cutting substrate at the bottom of the model. The ledger records every spec, every harness result, every acceptance decision, and every blocker. The metrics described here are views into that ledger.
What to Measure connects to:
- Intent: The Organizational Intent Control Plane, which connects the evidence ledger to purpose, authority, execution, and judgment
- The Flow Council, which uses leading indicators at weekly calibration
- The Intent Council, which uses outcome indicators at the biweekly session
- Continuous governance, because the three questions are answered by the evidence the metrics summarize
- The harness, whose results feed the rework location metric
Read the What to Measure white paper (PDF). Return to the Model to see how measurement connects to the rest of the system.